This post covers a few of the most common questions my customers ask me as I demonstrate what you can do with vROps. I’m going to take you through an example of needing to frequently check the CPU ready % of your VMs – this was my customer’s most recent request, but know that you can make this happen for any metric collected by vROps.
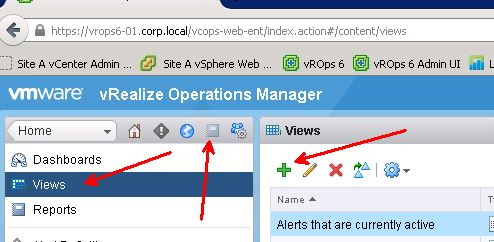
First, we’re going to create a custom view for CPU Ready % by going to Content>Views, then clicking on the green Plus to add a new View.
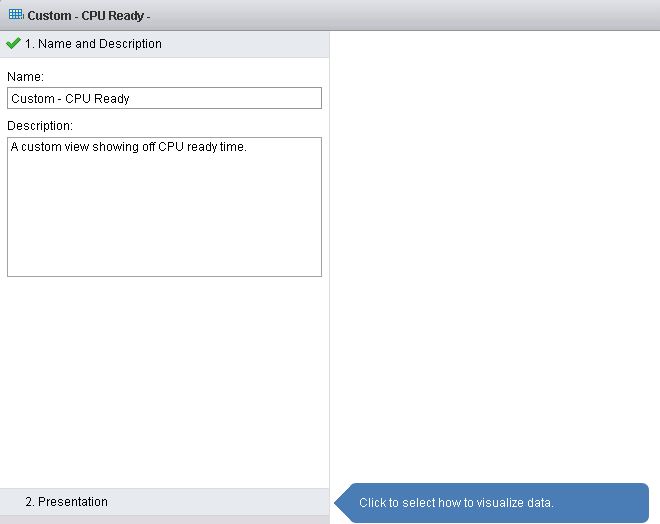
I named this one “Custom-CPU Ready” and gave it a description.
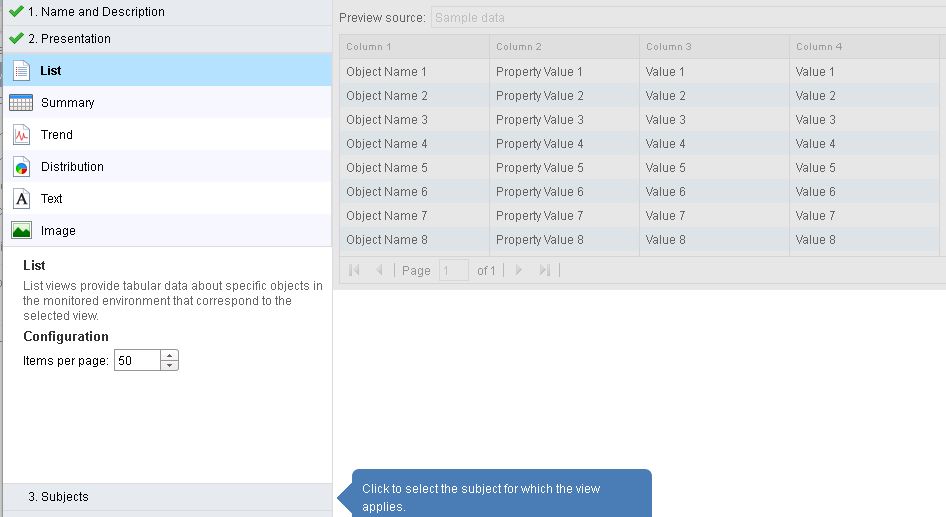
Next, pick what our View looks like. In this case, I want to see all of the data in a list format, so I pick List.
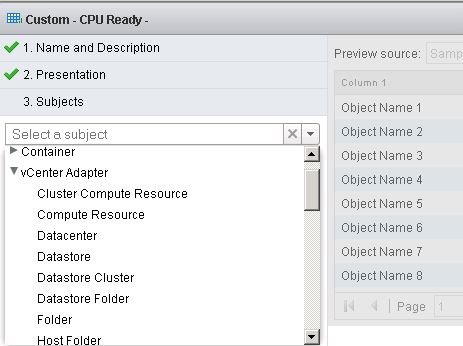
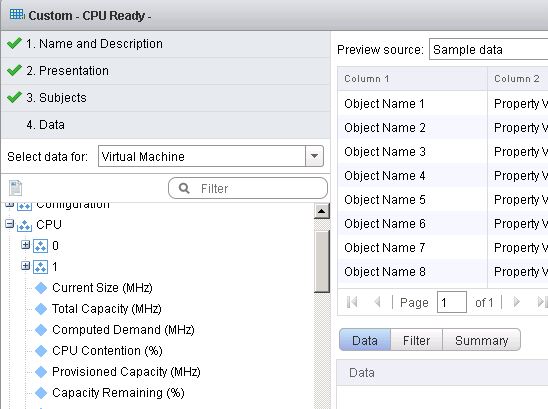
Now to select the subjects – these are the objects that the View will be looking at. We want CPU Ready % on Virtual Machines, so we pick the vCenter Adapter and scroll down until we find Virtual Machine.
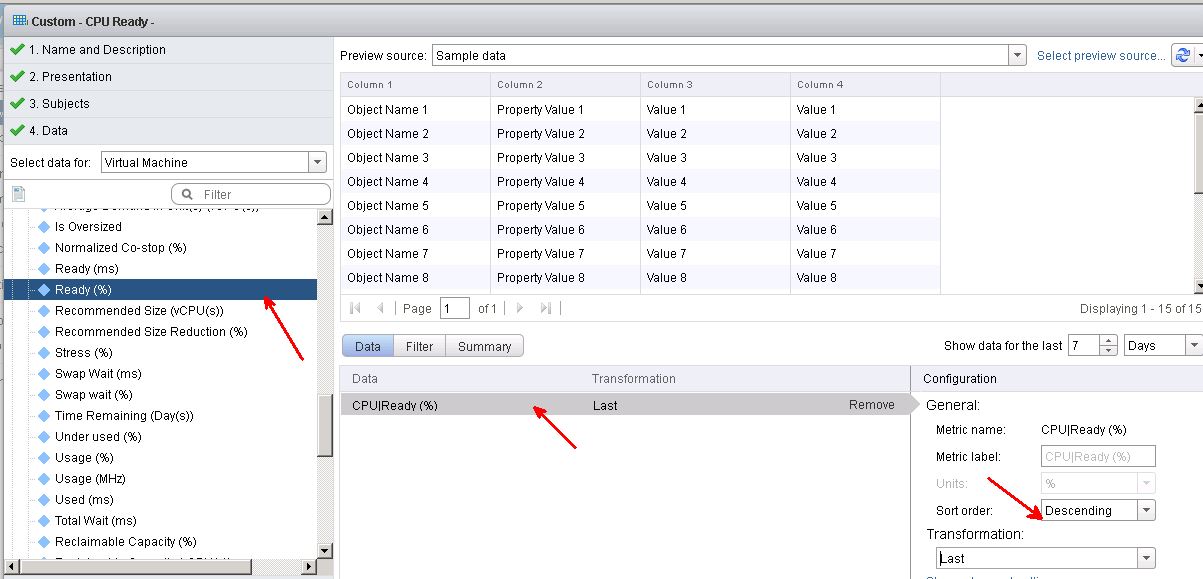
We now need to find the CPU Ready % metric
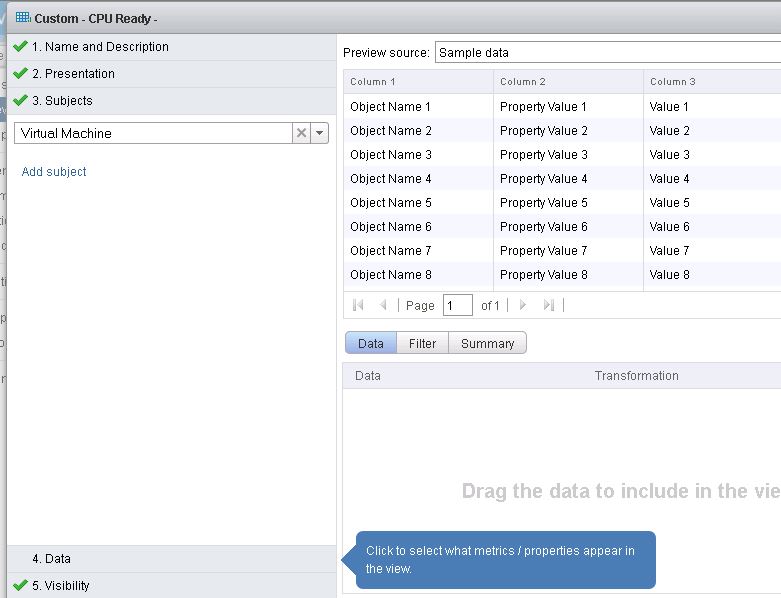
Double-click on it when you find it in the list on the left, it will then appear in the Data section. Change the Sort order to descending because we want to see the VM with the highest CPU ready on top.
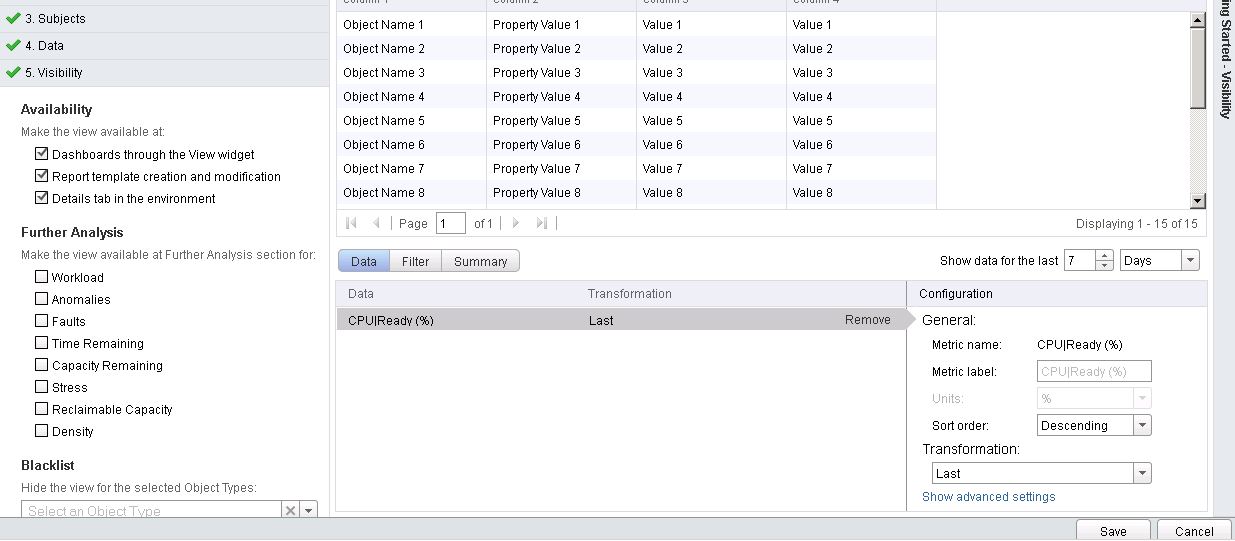
The Availability options let you control where inside vROps the View will be usable. I lef the defaults.
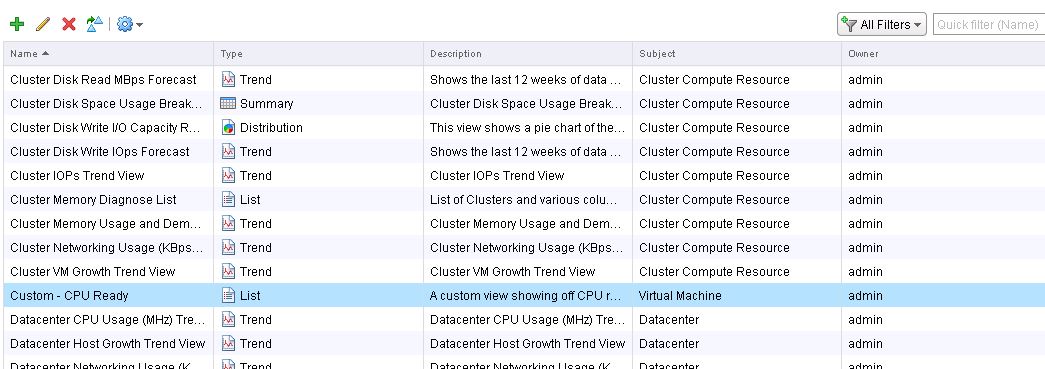
You now see the custom view in the Views list.
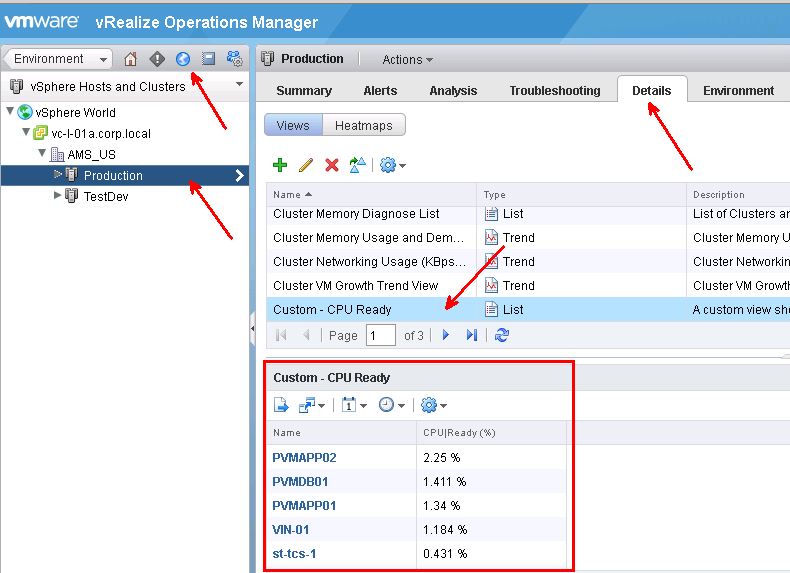
How can we use our brand new view? We want to see the CPU ready for all VMs in the Production cluster. Go to Environment, then drill down into the vSphere World until you reach the Production cluster. Click on the Details tab, you can then scroll down and find the custom View that we created. Click on it and all of your VMs show up, sorted by highest CPU ready.
Let’s say this is a metric that you look at at daily or multiple times a day. You can create a custom dashboard so the metric is immediately visible if you’re using vROps Advanced.
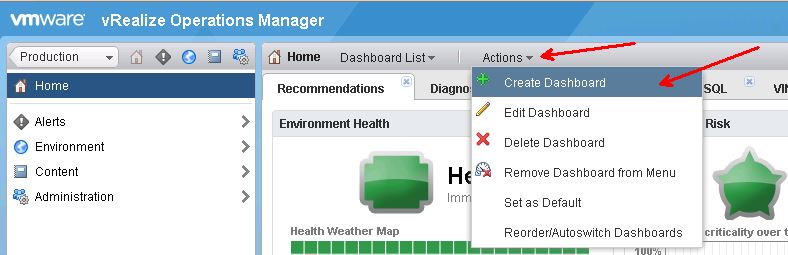
To create a new dashboard, from the Home menu, click Actions, then Create Dashboard
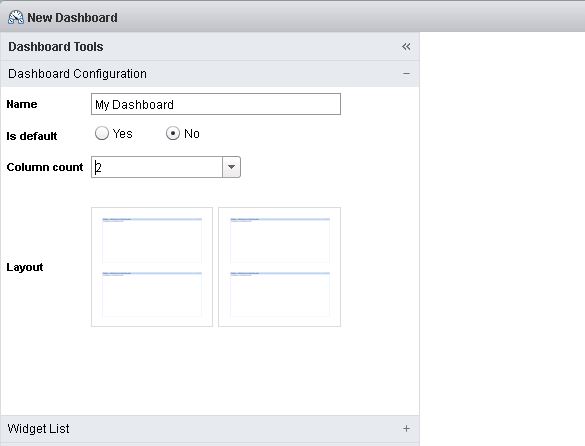
Name the dashboard and select a layout.
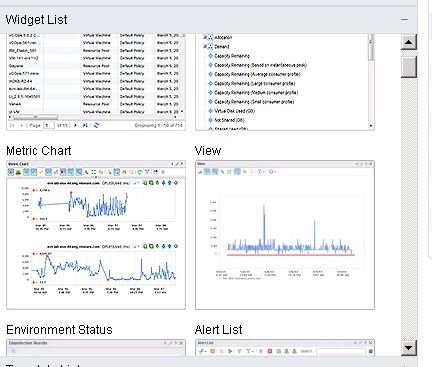
We want to show a View in the widget, so we drag View over into the right pane.
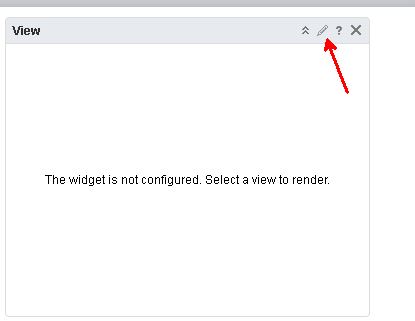
Click the Edit icon in the blank View to customize it.
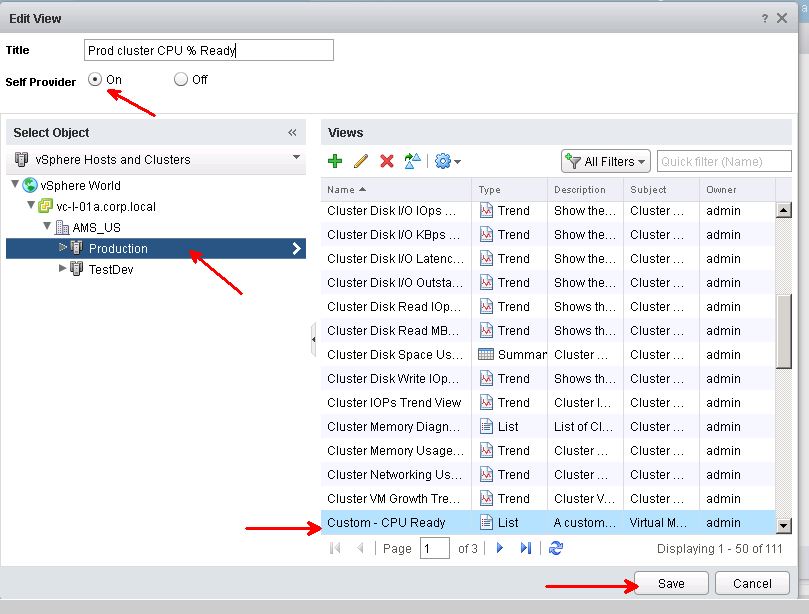
Click on Self Provider to allow us to specify the Production Cluster object on the left, then select our Custom CPU Ready View on the right and click Save.
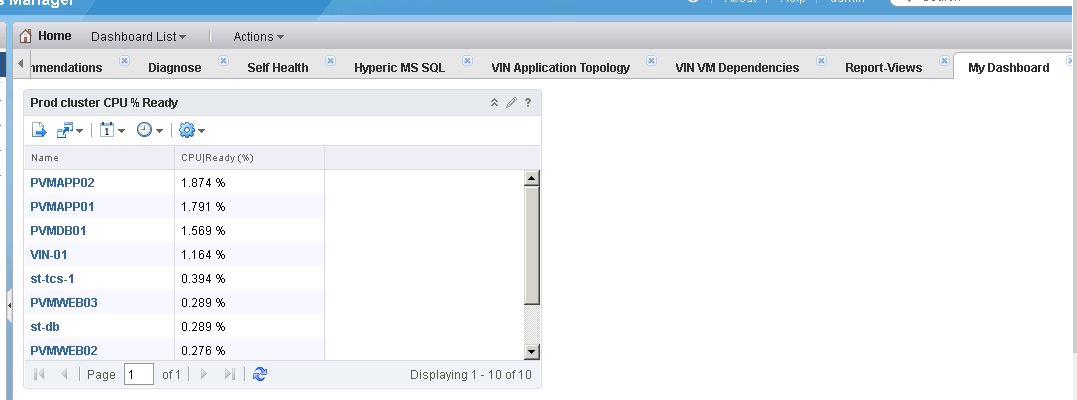
The dashboard is now ready. The CPU Ready for the Production VMs will now show up in the dashboard.
Olivier BROGUET
Hi,
I would like to have several custom groups in a custom dashboard with a View widget. Which object to select in Self Provider mode? I can only select one Custom Group at a time in my widget.
Tks for your help.
pkremer
Sorry, your comment got lost in my spam filter. How about making a custom group comprised of multiple custom groups?
cb
Any idea how to get the real figure’s of the CPU ready per ESX host instead of per virtual node ??
pkremer
Instead of picking ‘Virtual Machine’ as the subject, you could pick ‘Host System’, and then you’ll see a CPU Ready (ms) metric at the host level.