I was doing a vRealize Operations demo with a customer today and they had a specific request on how to see some CPU data. They wanted to see a list of physical hosts, CPU utilization metrics on each of those hosts, and then be able to drill into specific CPU stats for the VMs running on the host. We will create a custom dashboard to easily display this information.
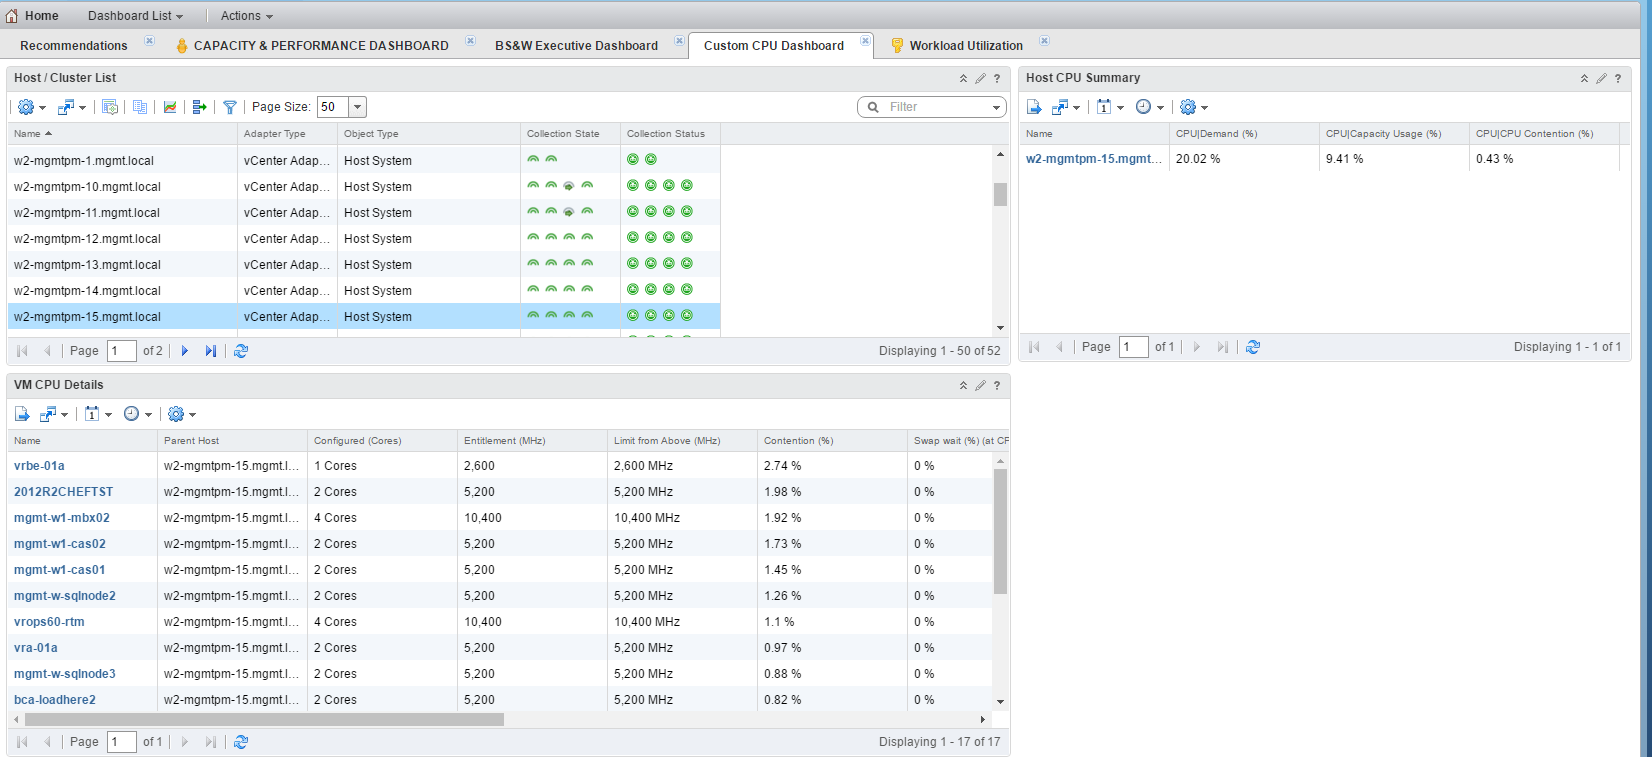
Here’s the finished product first. On the top left, we want all of our hosts and clusters to display. When you click on a host or cluster, we want the host metrics to show up in the top right box. Then, we want all of the VMs in the host or cluster to show up in the bottom left box with VM-specific metrics.
First, we want to create a new custom view for the host CPU metrics. There are many out-of-the-box views inside vROps – you can use any of them, or create your own. We will see both methods in this post – a custom view for the host metrics, and an out-of-the-box view for the VM metrics.
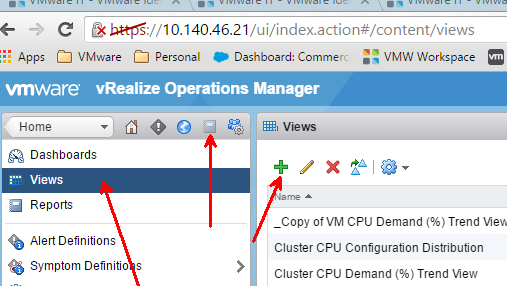
To create a new view, go into Views and click the green plus.
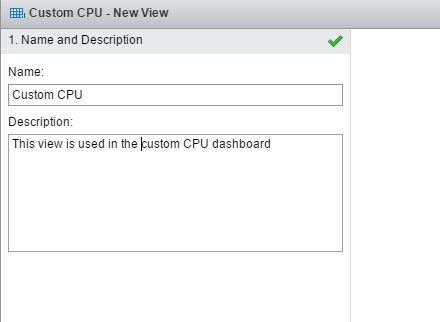
Name the view and add a description.
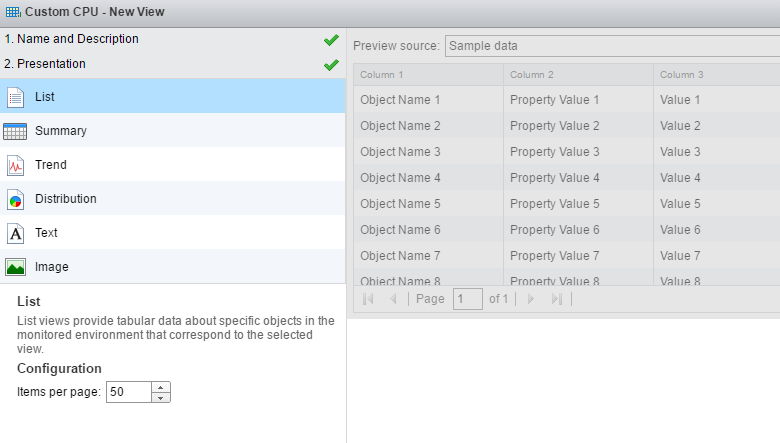
Pick how our data will display – in this case we’ll want the data displayed in a list format with columns.
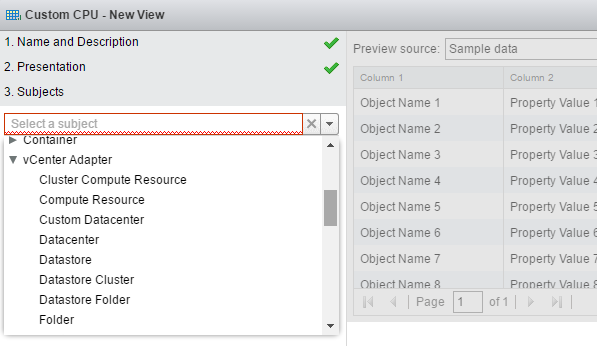
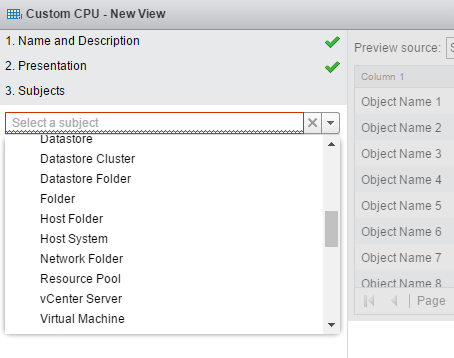
We want vSphere host metrics, which come from the vCenter Adapter. We pick vCenter Adapter, then Host System
We want 3 host metrics to show. CPU Demand will show me how much CPU the VMs on the host are demanding. CPU Capacity Usage will show me how much CPU is actually used. CPU Demand can be higher than CPU Capacity Used due to limits, either directly on the VM or imposed by resource pools. There are resource pool limits in this test environment, so we might expect to see higher CPU demand than usage. The final metric we want is CPU Contention. We drag them from the metrics on the right to the include box in the middle.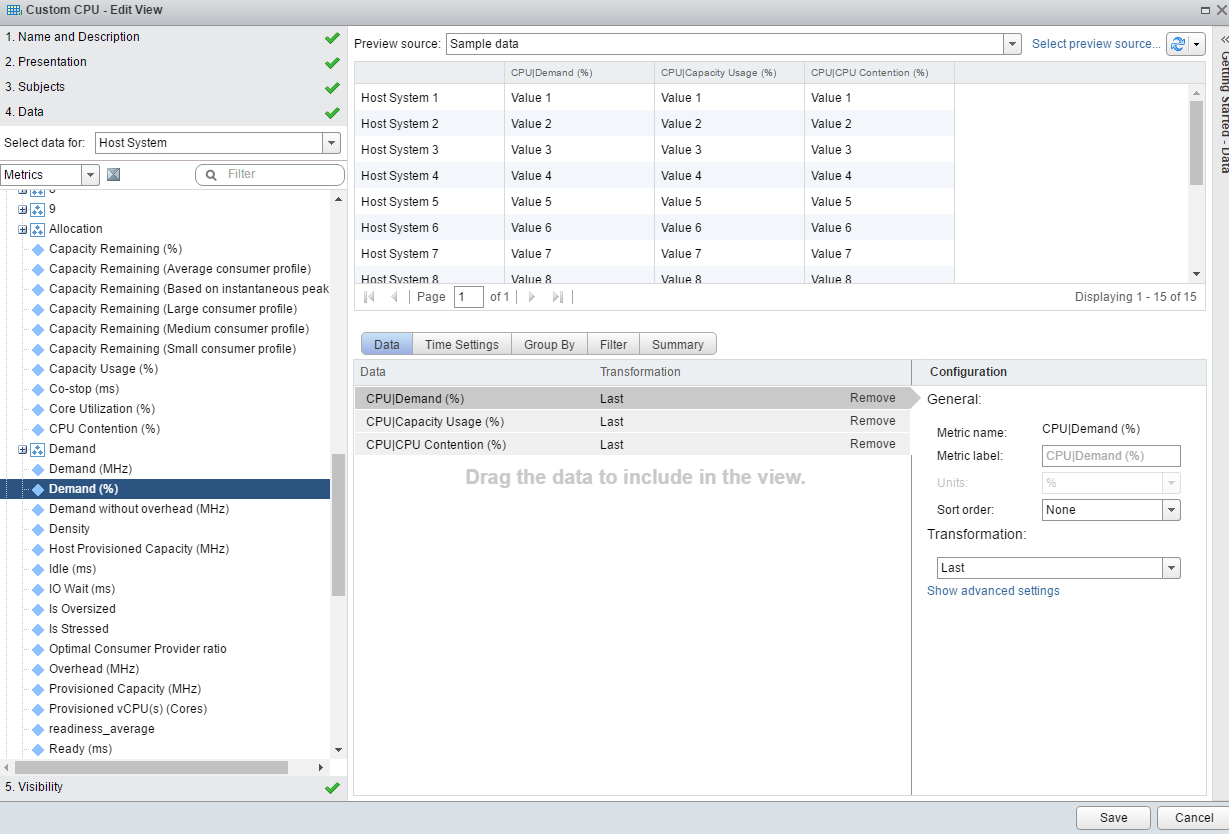
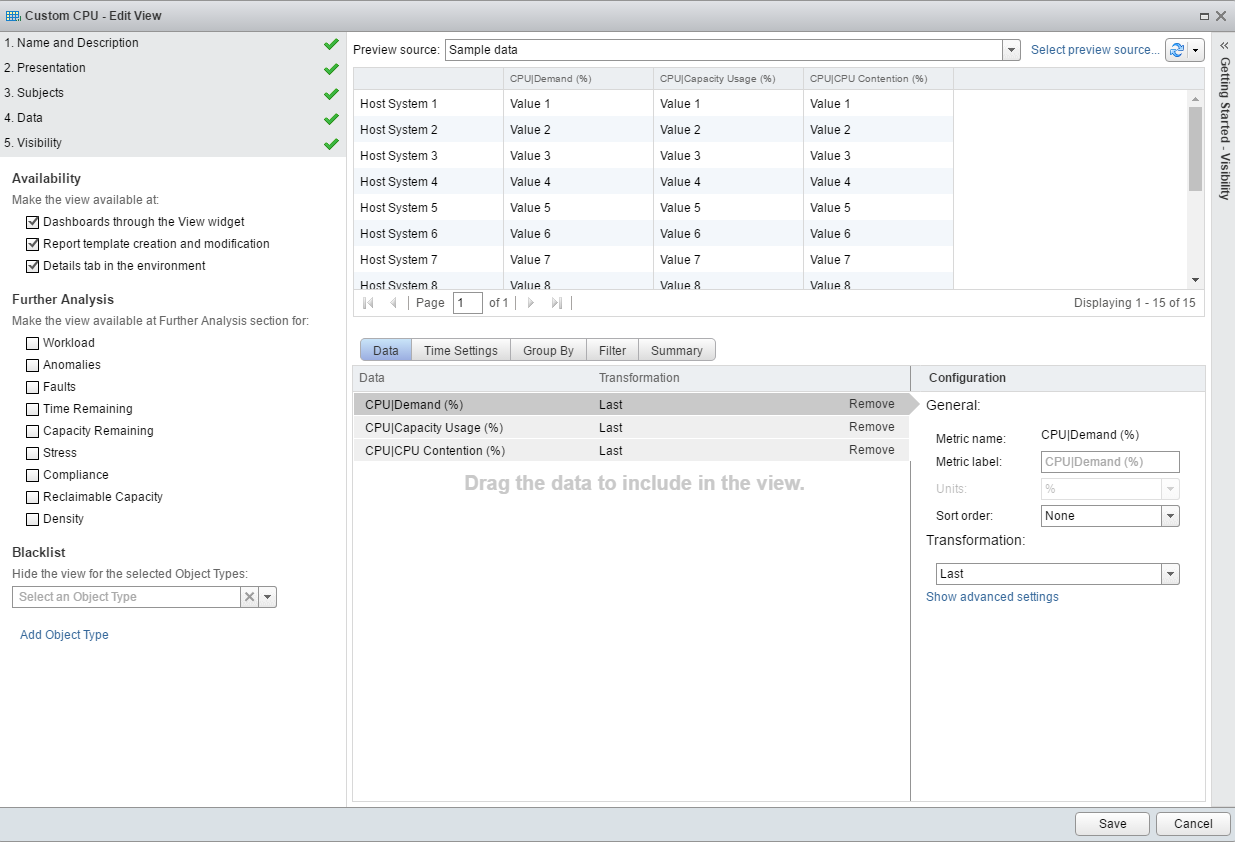
Finally, we pick the availability settings for our new view. We want to be able to include it in Dashboards, so we make sure that box is checked. A couple other boxes are checked by default – we leave them checked.
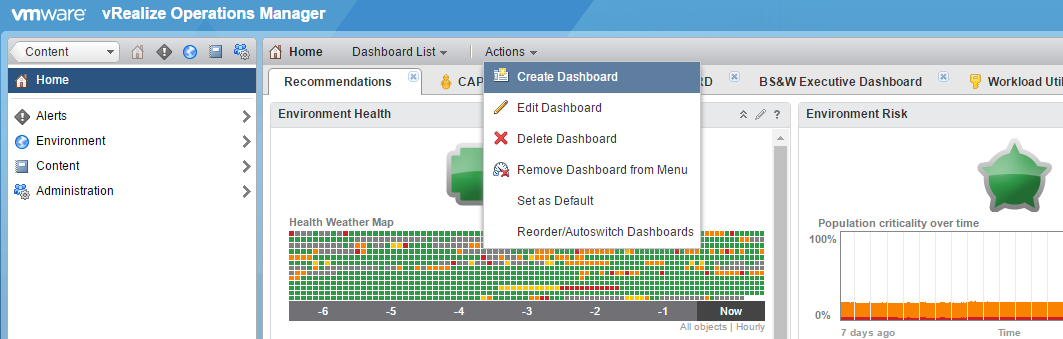
Now we create a new dashboard from the Home screen, click on Actions, then Create Dashboard.
Name the dashboard and provide a description.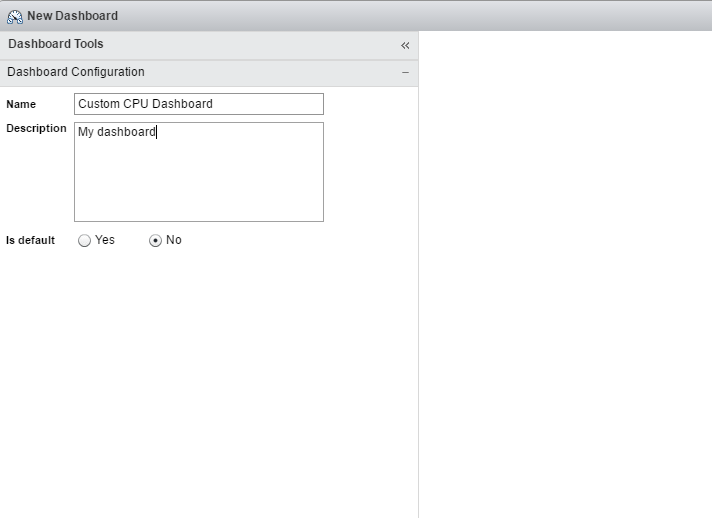
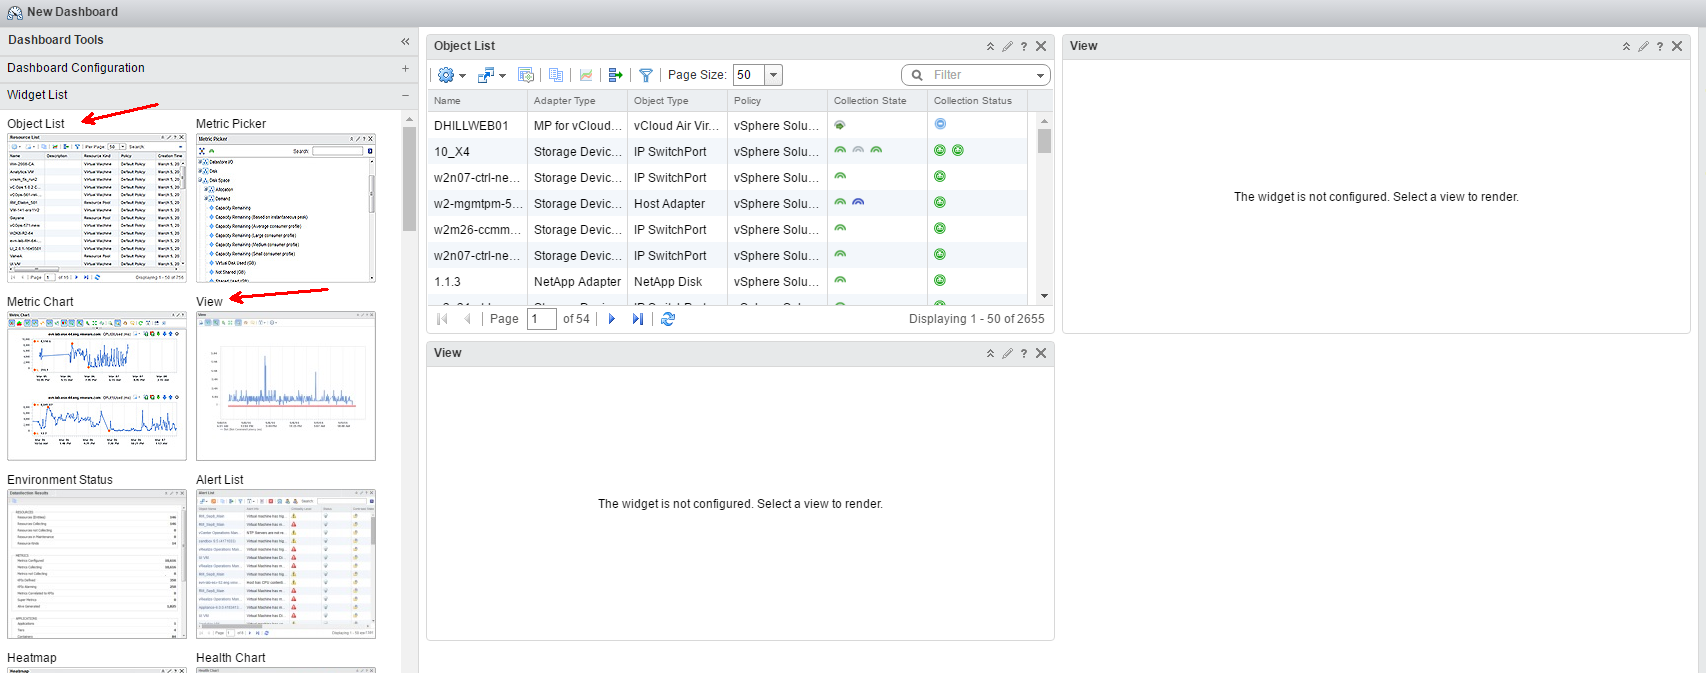
We’re going to add 3 widgets to our dashboard. First, we drag an Object List widget into the top left corner. We then drag a View widget into the top right and bottom left.
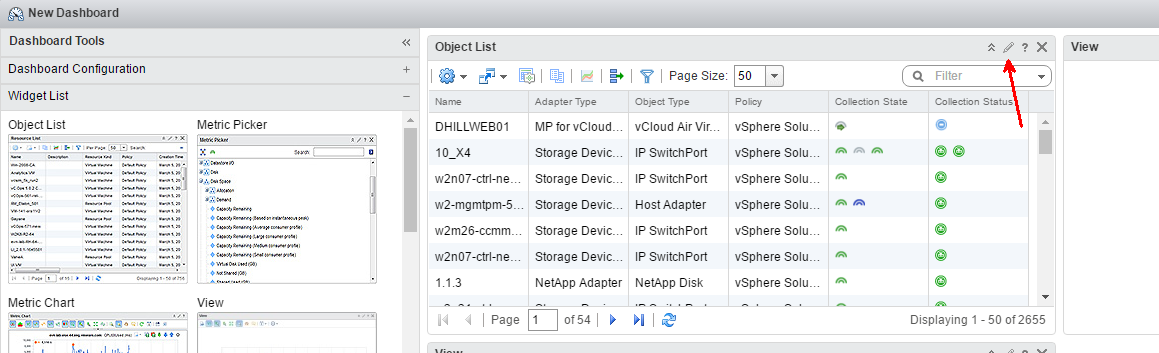
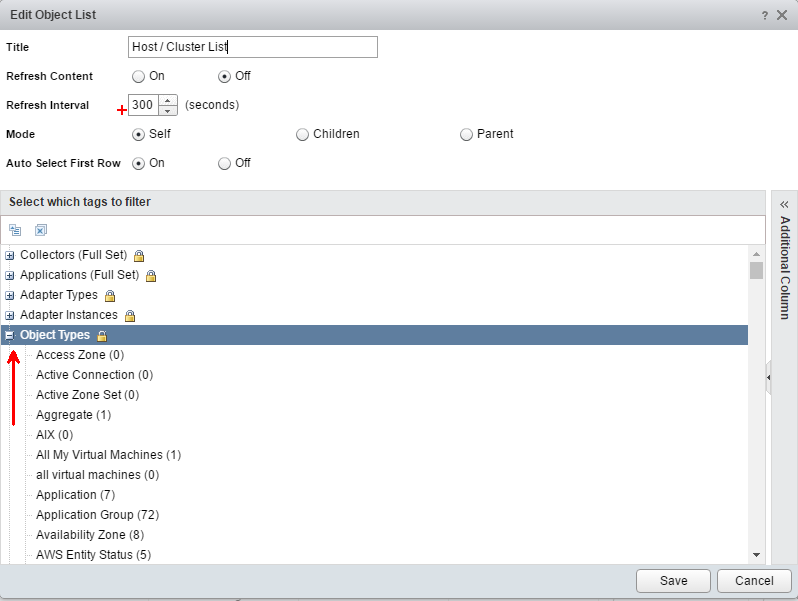
Now, we customize the Object List. Click on the Edit button.
We name the Object List. We only want vSphere Hosts and Clusters showing up, so we expand the Object Types option.
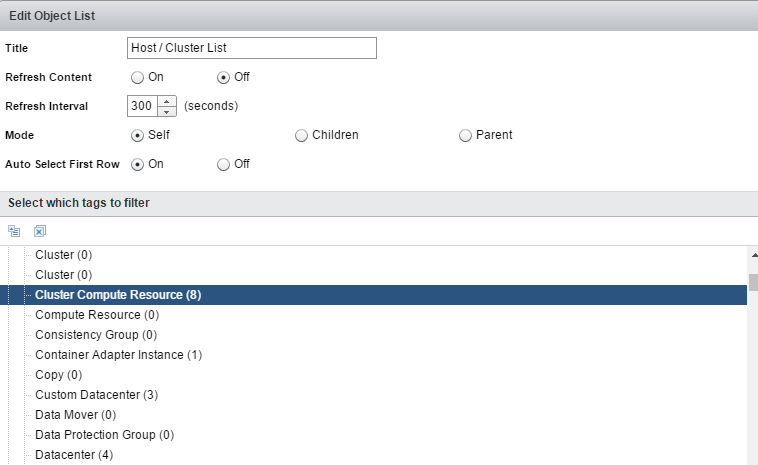
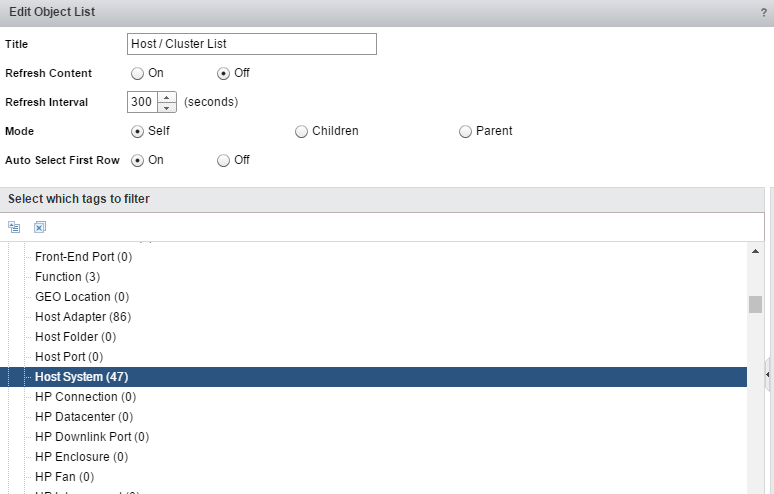
We want Cluster Compute Resources and Host System. We click on the first one, then Ctrl-Click to highlight both.
After these changes, we save the object list.
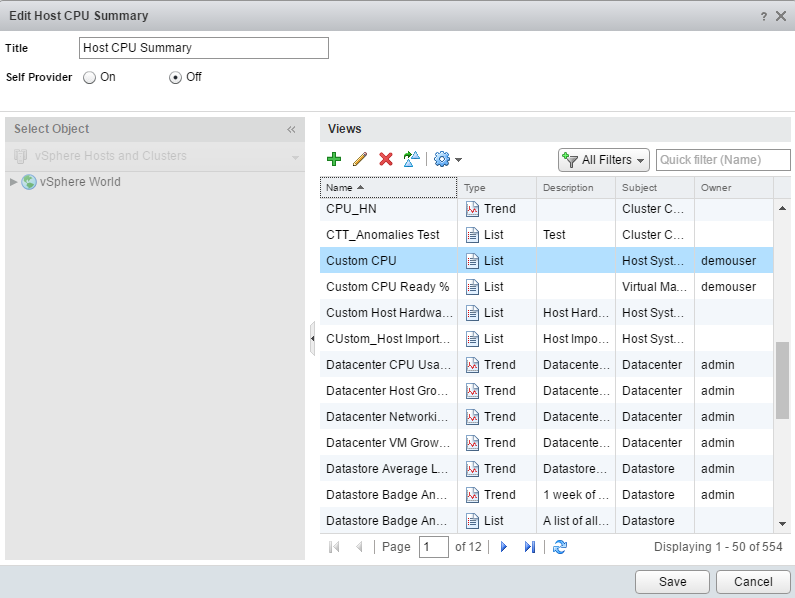
Now, we edit the View widget on the top right. We name it Host CPU Summary, then pick our Custom CPU view that we created at the beginning of this post.
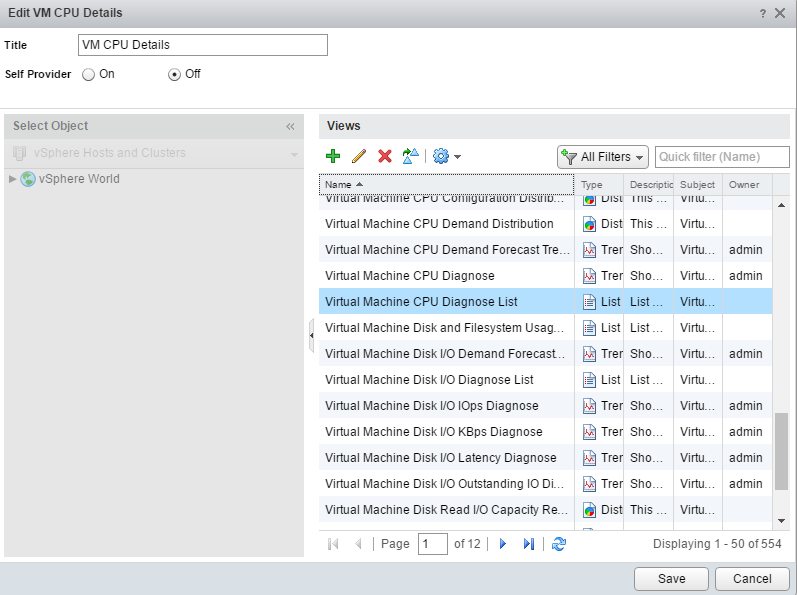
We edit the bottom left view widget. We name it VM CPU Details, and we pick a standard view called Virtual Machine CPU Diagnose List.
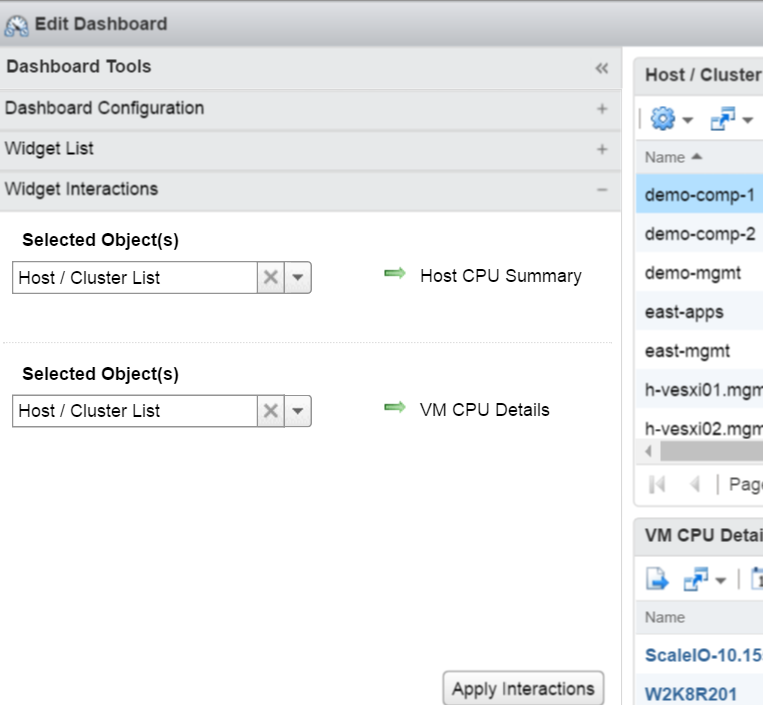
Finally, we modify the Widget interactions. When we select a host or cluster object in the Host / Cluster list box, we want it to change the two view boxes. We configure the Widget Interactions to use the Host / Cluster List selection as the data source, and we have it feed the Host CPU Summary and VM CPU Details view boxes. Click Apply Interactions to save the interactions.
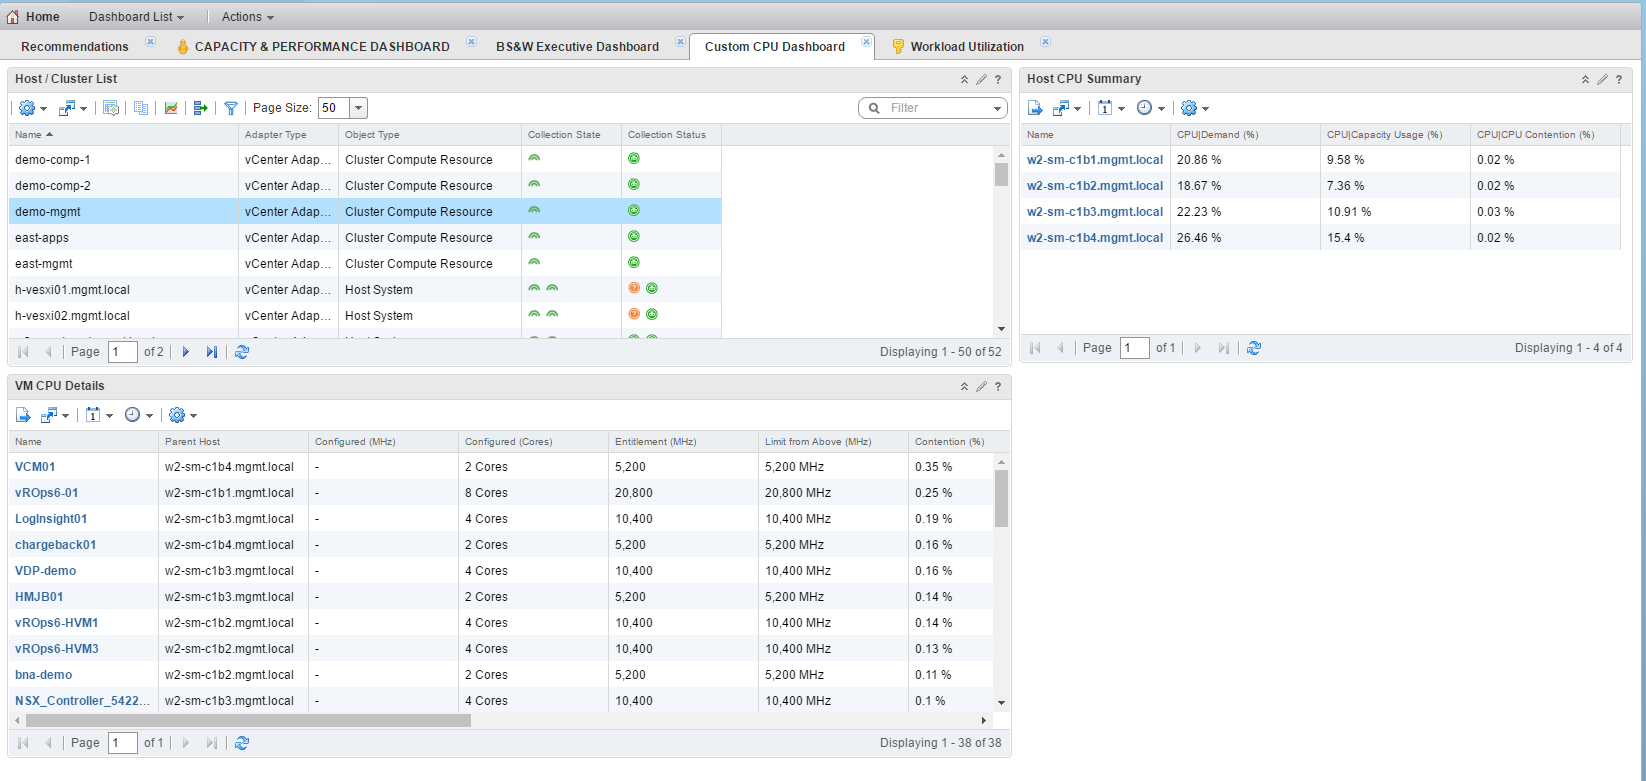
In our completed dashboard, we click on the demo-mgmt Cluster. All of the hosts in the cluster show up in the Host CPU Summary box. All of the VMs in the cluster show up in the VM CPU Details box.
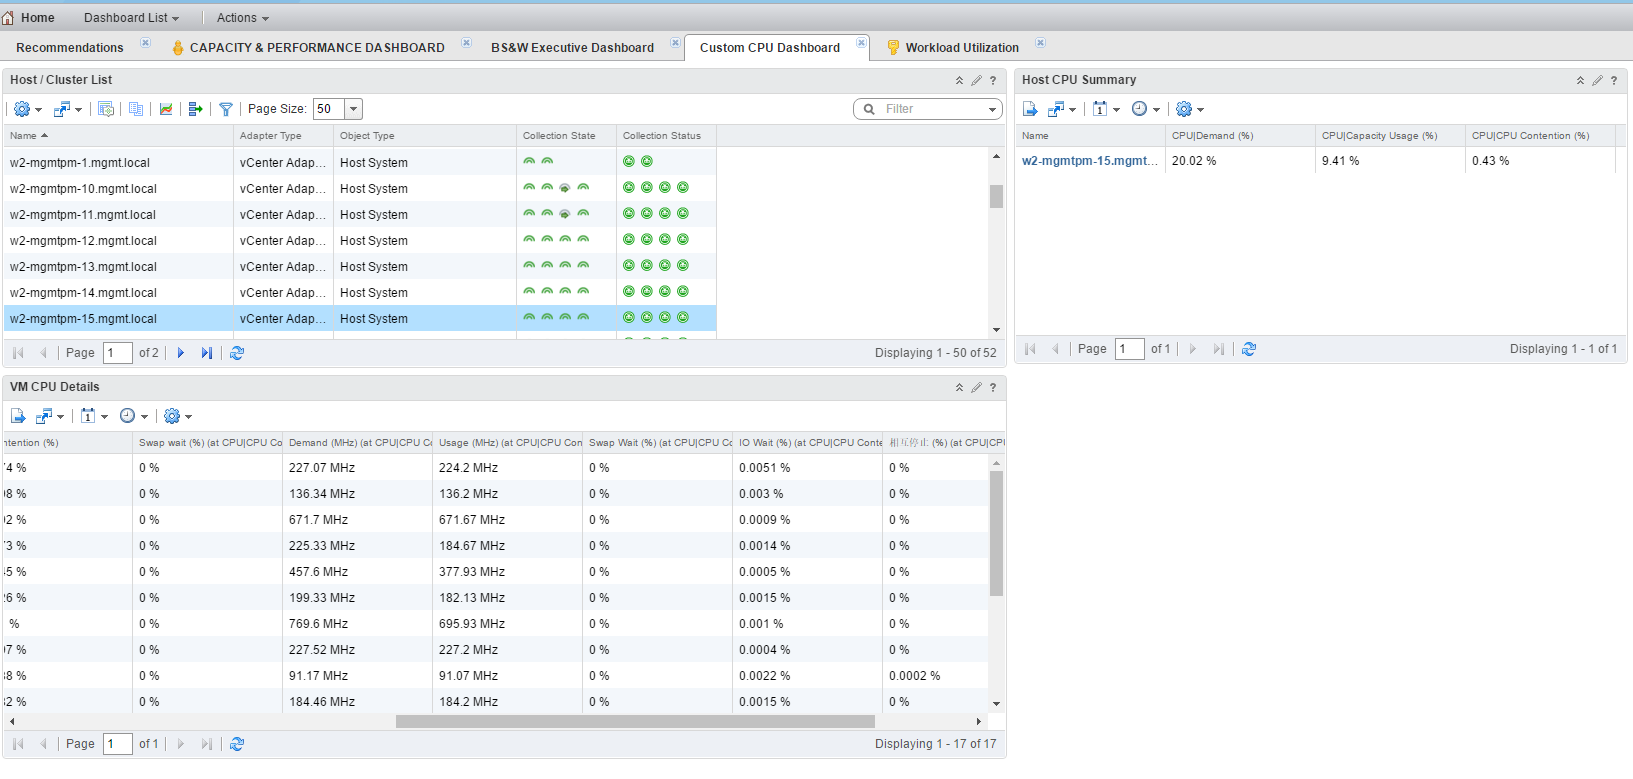
This is an example of clicking a single host – only the metrics for the one host show up in the Host CPU Summary box, and the VMs running on that one host show up in the VM CPU Details box.
Here we see more of the metrics available in the Virtual Machine CPU Diagnose List view. Again, we could have created a custom view for the widget instead – it all depends on what metrics you want to show.
Here is a link to the zipfile containing the JSON dashboard definition and the XML definition for the Custom CPU view that we created.