In Part II of this series, we looked at some of the resources that Easy Deploy built for us, including the sample load balanced application. At the end, we configured an advanced health monitor, pinging the load balanced nodes to determine health status. In this post, we will look at other active health monitors.
In the previous post, we added a ping monitor to the existing passive monitor. This improved availability of the website by quickly detecting a downed node. However, dropping completely off the network is only one of many ways a webserver can fail. What if the webserver daemon crashes? What if there’s a database error? This post explores how to configure an HTTP monitor.
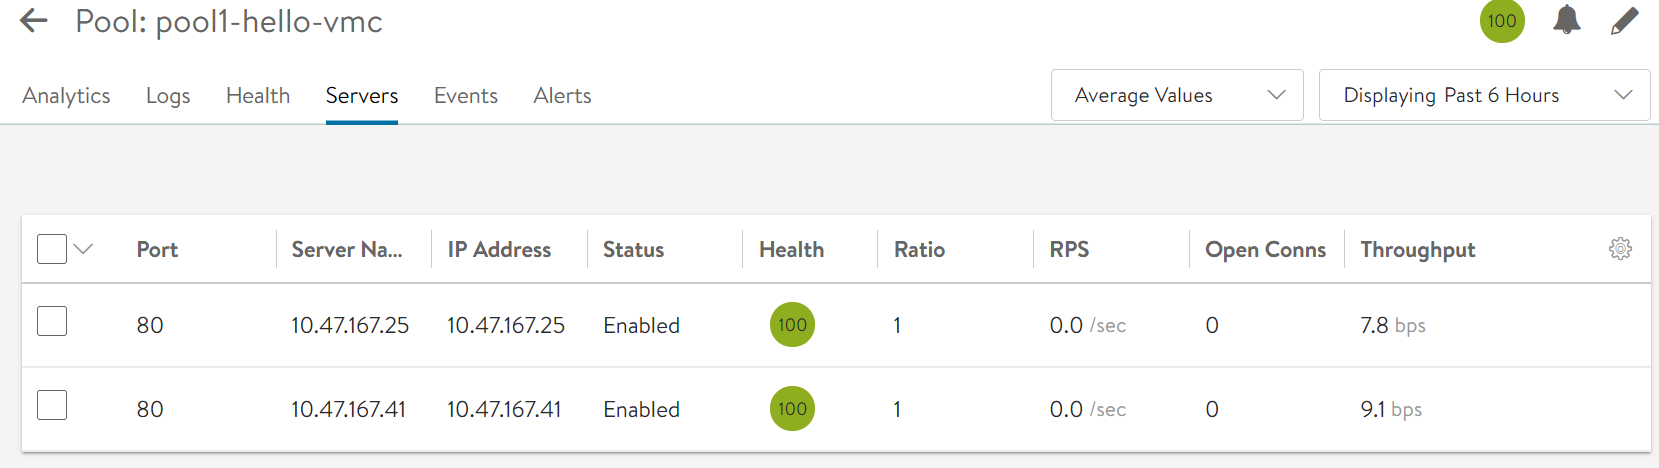
In this post, we are working with a brand new deployment with new IP addresses. Our webservers are named backend-0 (10.47.167.25) and backend-1 (10.47.167.41).
Health Monitor Templates
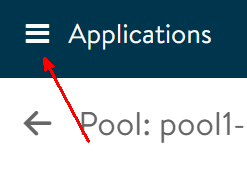
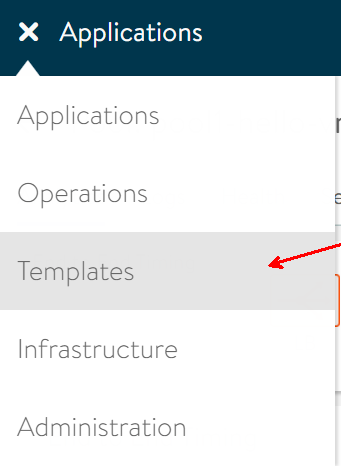
All of the templates for advanced monitors are in the templates section. Expand the menu in the top left corner of the Controller UI, then click Templates.
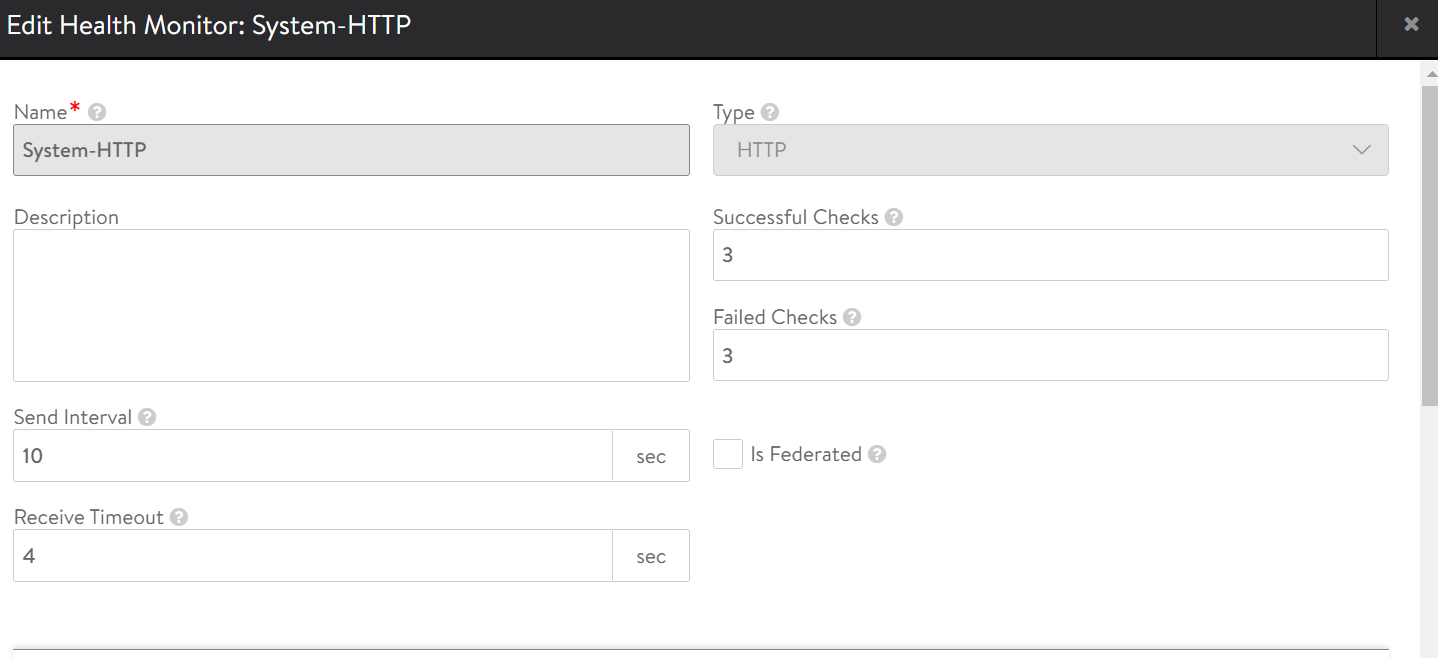
Click Health Monitors, then edit the System-HTTP template
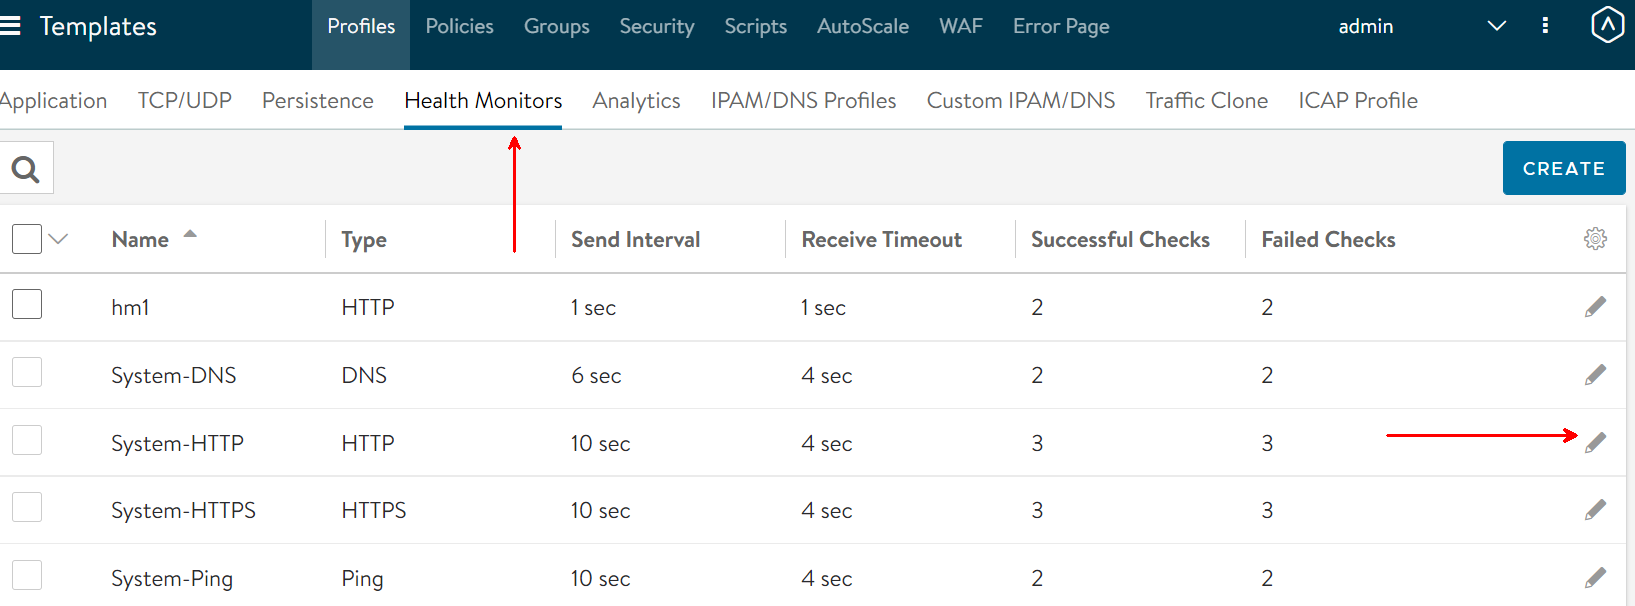
This monitor will mark a webserver as available when 3 consecutive checks are successful. It will mark a webserver unavailable when 3 consecutive checks fail. It checks every 10 seconds, and expects a webserver response within 4 seconds.
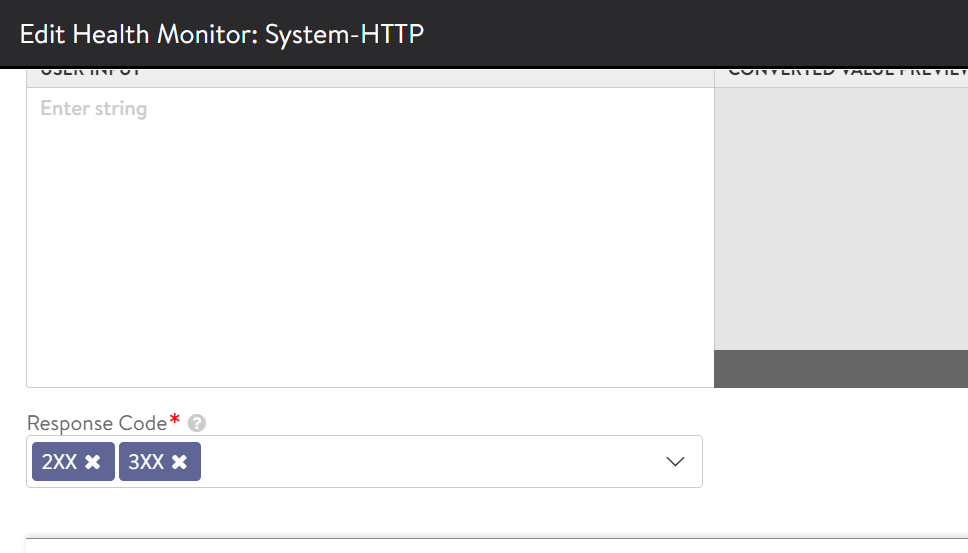
In the client request header, we see the HTTP command that will be sent to the webserver – a HEAD command.

The health check expects a 2xx or 3xx return code.
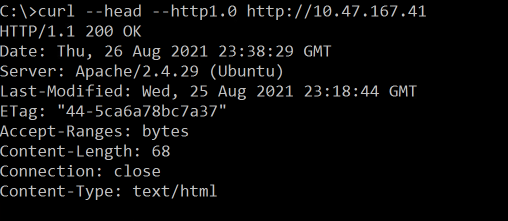
Let’s see what one of the webservers returns if we issue the same HEAD command. For this we use curl – a command line tool and library for transferring data with URLs. Whether you’re on Linux, Mac, or Windows, you can get curl.
The health monitor sends a HEAD request to /, via HTTP/1.0. To replicate this with curl, we use the following syntax:
curl --head --http1.0 http://10.47.167.41We get the following back:
Configuring the HTTP Monitor
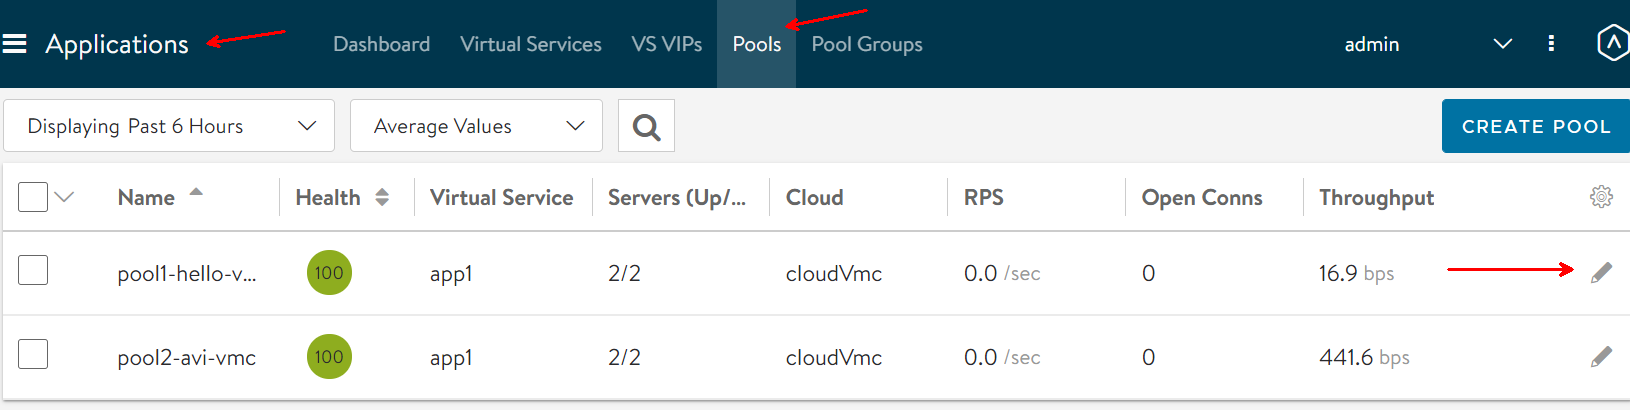
Expand the menu in the top left corner and switch back to Applications. Then click on Pools, and edit pool1-hello-vmc
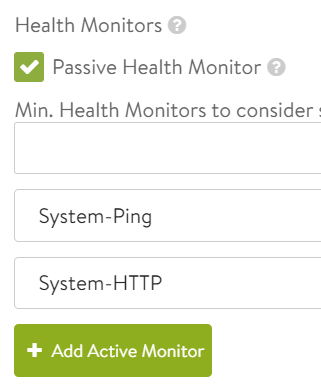
Click +Add Active Monitor

Select System-HTTP from the dropdown
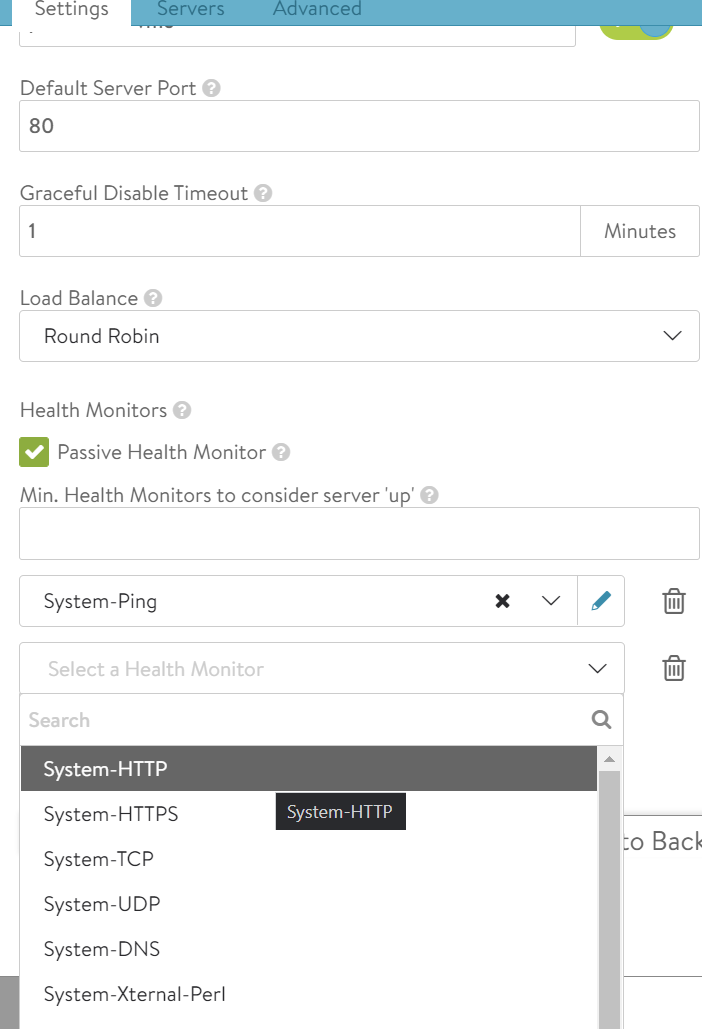
Click Save

The pool remains up.
Shut Down Apache
In the previous post, we shut down the entire webserver, which made the ping monitor fail. Here, we are going to keep the server online but shut down Apache. This should cause our HTTP monitor to disable the node.
If you had manually deployed your webservers, it would be easy to connect to them and stop the apache2 daemon. In this case, you do not have a username and password. You must retrieve the RSA key from one of the containers.
First, SSH to the EasyAvi appliance with username: root and the password you configured when you installed the OVA
Once logged in, type
docker psYou will see 2 containers – an easyavi container and a mongo container. Connect to a shell in the easyavi container with the command:
docker exec -it easyavi /bin/bashChange to the directory with the RSA key and run ls
cd /root/.ssh
ls
SSH to one of the webservers with the command:
ssh -i id_rsa ubuntu@10.47.167.41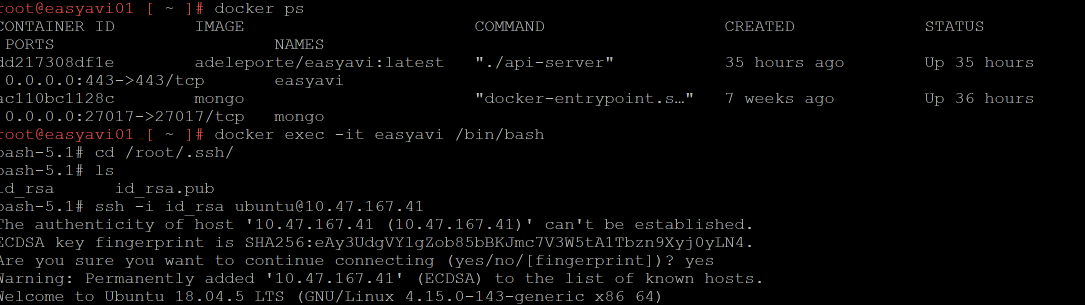
Stop the apache2 daemon with the command:
sudo /etc/init.d/apache2 stop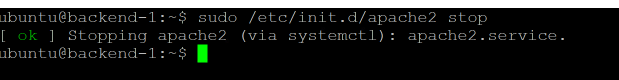
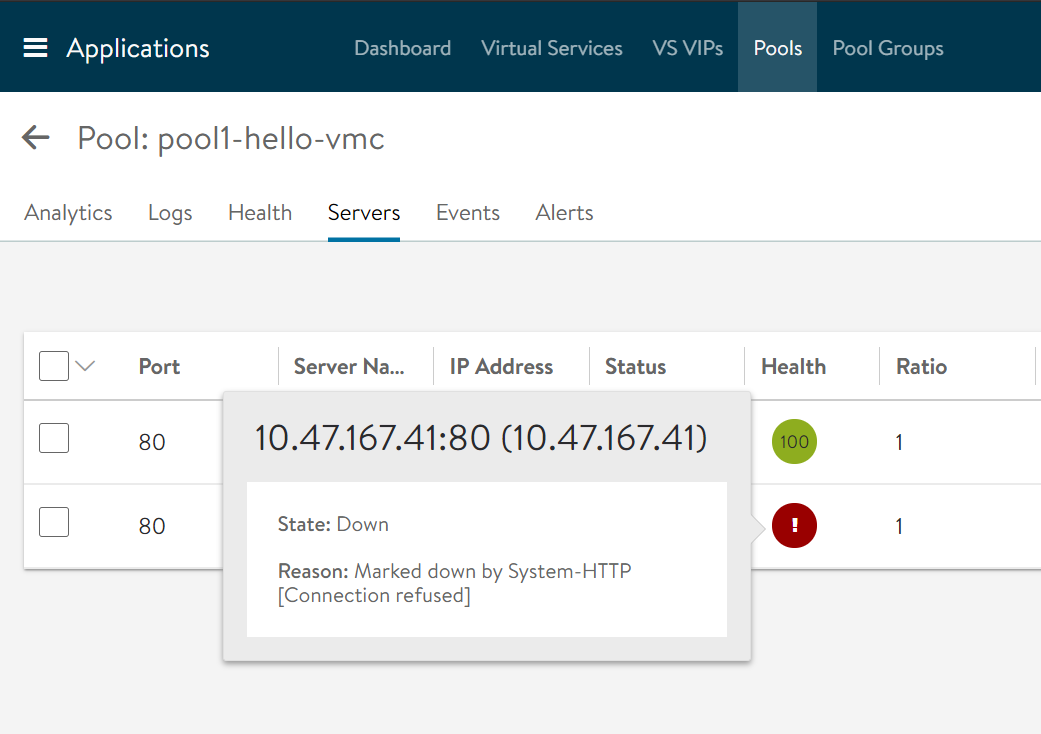
The node is marked down.
Start the apache2 daemon with the command:
sudo /etc/init.d/apache2 start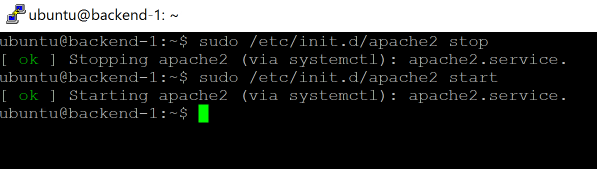
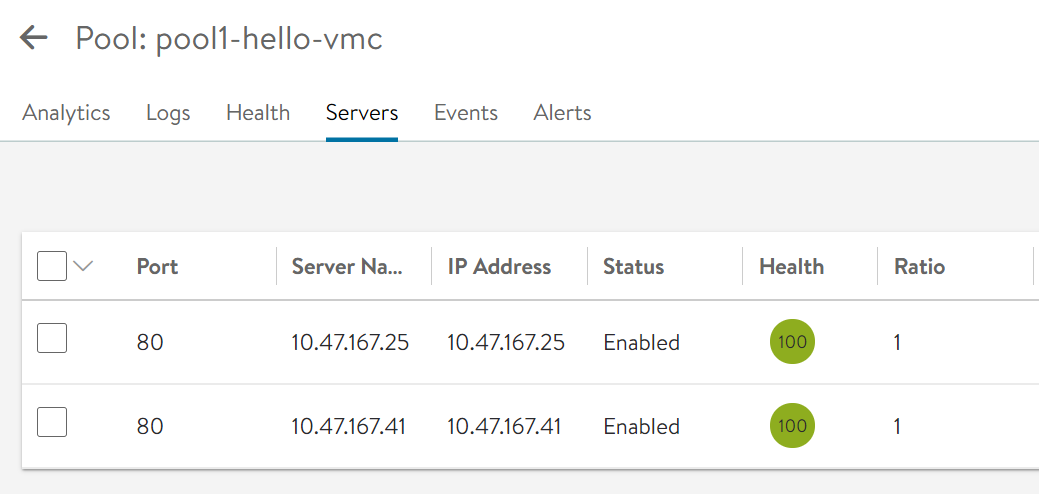
The node is available again once the HTTP check passes.
That’s all for this post. In the next post, we will explore health check maintenance mode configuration.
NSX Advanced Load Balancer – Part IV – Health Check Maintenance Mode -
[…] Part III of this series, we looked active health monitors for the sample web application created by Easy […]
NSX Advanced Load Balancer – Part II – Examining the Easy Deploy Resources -
[…] all for this post. In the next post, we will add an active HTTP […]